Chrome UX Report (CrUX)
Chrome browsers around the world send anonymized performance data to Google for users that are logged in to their Google account and have enabled auto-sync on Chrome. Websites that receive a decent amount traffic are included in a report (Chrome UX Report, or "CrUX") which is publicly available.
PageVitals mixes in this data in your dashboard and your page reports. Let's take a look at how that works.
The dashboard
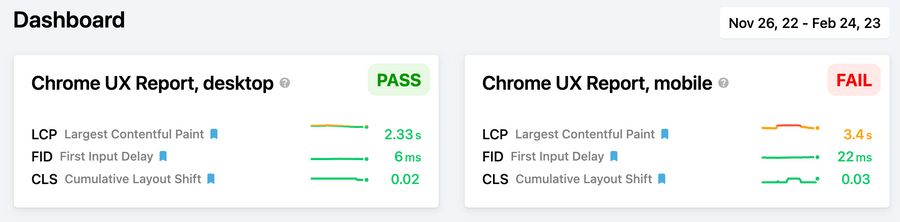
If you have enough traffic on your total website, we'll show you the overall CrUX metrics on the dashboard, split into desktop and mobile. We'll show you the Core Web Vitals (Largest Contentful Paint, First Input Delay and Cumulative Layout Shift), and we'll also show you if the Core Web Vitals pass or fail.
CrUX in the page list
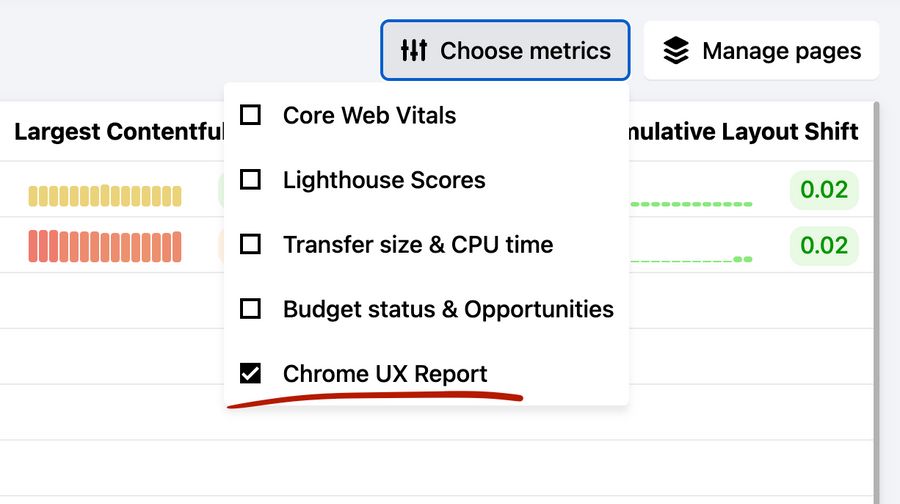
If you click "Pages" you'll see your list of pages and some metrics and charts for each of those pages - in both desktop and mobile versions. If you click the "Choose metrics" button above the list, and select "Chrome UX Report", you'll see the three most important metrics from the CrUX report, the Core Web Vitals:
- Largest Contentful Paint (LCP)
- First Input Delay (FID)
- Cumulative Layout Shift (CLS)
You may not see any data at all if your pages haven't got the traffic needed to be included in the report. And you may see gaps in the data because you pages may have fallen in and out of the report.
CrUX in the individual page report
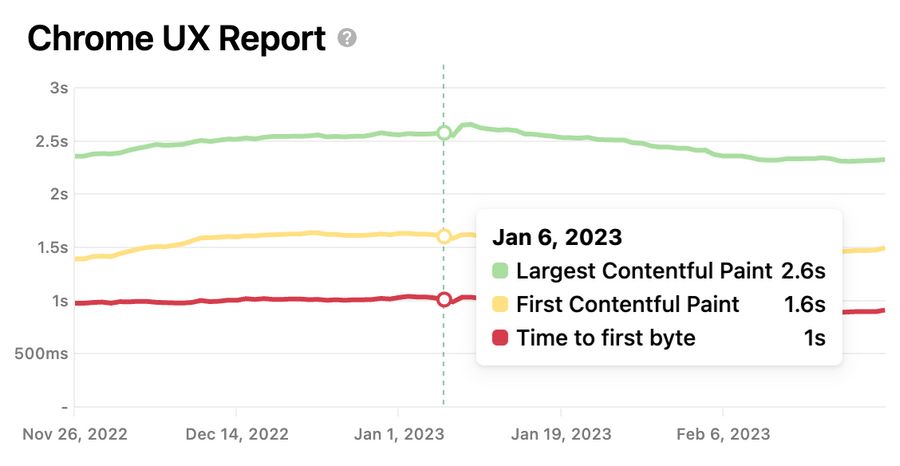
If you click one of the pages in the list and scroll down to the "Chrome UX Report" section, you'll see a more detailed timeline chart with the CrUX data (if it's available).
How CrUX data correlates with Lighthouse data
We're written a guide to help you understand the difference between synthetic data such as Lighthouse reports, and real-world performance data, such as CrUX. Read the guide here.
You can read a lot more about Chrome UX Report here